Chemometrics and Computational Physics (R package by Katherine Mulllen at UCLA)
2 posters
Page 1 of 1

Chemometrics and Computational Physics (R package by Katherine Mulllen at UCLA)
![]() by Cr6 Wed Aug 07, 2019 12:53 am
by Cr6 Wed Aug 07, 2019 12:53 am
Hey Guys,
Came across this recent R package. Looks like it was a school project at UCLA recently. Has pretty good coverage of topics and areas of focus that Miles (and team) has touched on over the years. Worth checking out especially the SOM functions:
https://cran.r-project.org/web/views/ChemPhys.html
-------------------
Chemometrics and Computational Physics
Maintainer: Katharine Mullen
Contact: katharine.mullen at stat.ucla.edu
Version: 2019-06-04
URL: https://CRAN.R-project.org/view=ChemPhys
Chemometrics and computational physics are concerned with the analysis of data arising in chemistry and physics experiments, as well as the simulation of physico-chemico systems. Many of the functions in base R are useful for these ends.
The book Chemometrics with R by Ron Wehrens, ISBN: 978-3-642-17840-5, Springer, 2011, provides an introduction to multivariate statistics in the life sciences, as well as coverage of several specific topics from the area of chemometrics; the examples in the book are possible to reproduce using the package ChemometricsWithR.
The book Modern Statistical Methods for Astronomy With R Applications by Eric D. Feigelson and G. Jogesh Babu, ISBN-13: 9780521767279, Cambridge, 2012, provides an introduction to statistics for astronomers and an overview of the foremost methods being used in astrostatistical analysis, illustrated by examples in R.
The book by Kurt Varmuza and Peter Filzmoser, Introduction to Multivariate Statistical Analysis in Chemometrics, ISBN 978-1-420-05947-2, CRC Press, 2009, is associated with the package chemometrics.
A special issue of R News with a focus on R in Chemistry was published in August 2006. A special volume of Journal of Statistical Software (JSS) dedicated to oscopy and Chemometrics in R was published in January 2007.
Please let us know if we have omitted something of importance, or if a new package or function should be mentioned here.
Linear Regression Models
Linear models can be fitted (via OLS) with lm() (from stats). A least squares solution for x in Ax = b can also be computed as qr.coef(qr(A), b).
The package nnls provides a means of constraining x to non-negative or non-positive values; the package bvls allows other bounds on x to be applied.
Functions for isotonic regression are available in the package Iso, and are useful to determine the unimodal vector that is closest to a given vector x under least squares criteria.
Heteroskedastic linear models can be fit using the gls() function of the nlme package.
Nonlinear Regression Models
The nls() function (from stats) as well as the package minpack.lm allow the solution of nonlinear least squares problems.
Correlated and/or unequal variances can be modeled using the gnls() function of the nlme package and by nlreg.
Curve Resolution
The PTAk package provides functions for Principal Tensor Analysis on k modes. The package includes also some other multiway methods: PCAn (Tucker-n) and PARAFAC/CANDECOMP.
Multivariate curve resolution alternating least squares (MCR-ALS) is implemented in the package ALS.
The alsace package provides MCR-ALS support for Liquid chromatography with PhotoDiode Array Detection (LC-DAD) data with many injections, with features for peak alignment and identification.
The package drc provides functions for the analysis of one or multiple non-linear curves with focus on models for concentration-response, dose-response and time-response data.
Partial Least Squares
The package pls implements Partial Least Squares Regression (PLSR) and Principal Component Regression (PCR).
The package lspls implements the least squares-partial least squares (LS-PLS) method.
Penalized Partial Least Squares is implemented in the ppls package.
Sparse PLS is implemented in the package spls package.
The gpls package implements generalized partial least squares, based on the Iteratively ReWeighted Least Squares (IRWLS) method of Brian Marx.
Package plspm contains, in addition to the usual functions for PLS regression, also functions for path modeling.
The package enpls implements ensemble partial least squares, a framework for measuring feature importance, outlier detection, and ensemble modeling based on (sparse) partial least squares regressions.
Principal Component Analysis
Principal component analysis (PCA) is in the package stats as functions princomp(). Some graphical PCA representations can be found in the psy package.
The homals package provides nonlinear PCA and, by defining sets, nonlinear canonical correlation analysis (models of the Gifi-family).
A desired number of robust principal components can be computed with the pcaPP package. The package elasticnet is applicable to sparse PCA. The package fpca can be applied to restricted MLE for functional PCA.
See the Multivariate task view for further packages dealing with PCA and other projection methods.
Factor Analysis
Factor analysis (FA) is in the package stats as functions factanal(); see Psychometrics task view for details on extensions.
Compositional Data Analysis
The package compositions provides functions for the consistent analysis of compositional data (e.g. portions of substances) and positive numbers (e.g. concentrations). See also the book, Analyzing Compositional Data with R by K. Gerald von den Boogaart und Raimon Tolosana-Delgado, ISBN: 978-3-642-36808-0, Springer, 2013.
Independent Component Analysis
Independent component analysis (ICA) can be computed using fastICA.
Clustering
The Cluster task view provides a list of packages that can be used for clustering problems.
Variable Selection
Stepwise variable selection for linear models, using AIC, is available in function step(); package leaps implements leaps-and-bounds variable selection, by default using Mallow's Cp. stepPlr provides stepwise variable selection for penalized logistic regression.
Variable selection based on evolutionary algorithms is available in package and subselect. The latter also provides simulated annealing and leaps-and-bounds algorithms, as well as local refinements.
Package varSelRF provides variable selection methods for random forests. Cross-validation-based variable selection using Wilcoxon rank sum tests is available in package WilcoxCV, focused on binary classification in microarrays. Package clustvarsel implements variable selection for model-based clustering.
The BioMark package implements two meta-methods for variable selection: stability selection (applying a primary selection method like a t-test, VIP value or PLSDA regression coefficient) to different subsets of the data, and higher criticism, which provides a data-driven choice of significance cutoffs in statistical testing.
Self-Organizing Maps
The kohonen package implements self-organizing maps as well as some extensions for supervised pattern recognition and data fusion. The som package provides functions for self-organizing maps.
Differential Equations
See the DifferentialEquations task view packages dealing with differential equations.
Metrology
The units package attaches unit metadata to vectors, matrices and arrays, providing automatic propagation, conversion, derivation and simplification of units.
The errors attaches uncertainty metadata to vectors, matrices and arrays, providing automatic propagation and reporting.
The constants package provides values of the fundamental physical constants based on values reported by the Committee on Data for Science and Technology (CODATA), an interdisciplinary committee of the International Council for Science.
NISTunits also provides values of the fundamental physical constants. The values it contains are based on the values reported by the National Institute of Standards and Technology, (NIST).
The measurements contains tools to make working with physical measurements easier, such as functions to convert between metric and imperial units, or to calculate a dimension's unknown value from other dimensions' measurements.
The metRology package provides support for metrology applications, including measurement uncertainty estimation and inter-laboratory metrology comparison studies.
The ATmet package provides functions for smart sampling and sensitivity analysis for metrology applications, including computationally expensive problems.
Calibration
The investr package facilitates calibration/inverse estimation with linear and nonlinear regression models.
The chemCal package provides functions for plotting linear calibration functions and estimating standard errors for measurements.
The nlreg package is useful for nonlinear calibration models.
The package represent calculates the 'representativity' of two multidimensional datasets, which involves comparison of the similarity of principal component analysis loading patterns, variance-covariance matrix structures, and data set centroid locations.
Cellular Automata
The simecol package includes functions for cellular automata modeling.
Thermodynamics
The CHNOSZ package provides functions for calculating the standard Gibbs energies and other thermodynamic properties, and chemical affinities of reactions between species contained in a thermodynamic database.
Interfaces to External Libraries
The package rcdk allows the user to access functionality in the Chemistry Development Kit (CDK), a Java framework for cheminformatics. This allows the user to load molecules, evaluate fingerprints (via the package fingerprint), calculate molecular descriptors and so on. In addition, the CDK API allows the user to view structures in 2D. The rcdklibs package provides the CDK libraries for use in R.
The rpubchem package gives access to PubChem data (compounds, substance, assays).
ChemmineR is a cheminformatics toolkit for analyzing small molecules in R. Its add-on packages include fmcsR for mismatch tolerant maximum common substructure matching, eiR for accelerated structure similarity searching; bioassayR for analyzing bioactivity data, and ChemmineOB for accessing OpenBabel functionalities from R.
The webchem package allows users to retrieve chemical information from various sources on the web and to interact with various APIs. Sources include: Chemical Identifier Resolver , ChemSpider , PubChem , Chemical Translation Service , PAN Pesticide Database , Alan Wood's Compendium of Pesticide Common Names , PHYSPROP Database , ETOX , PPDB , and ChemIDplus .
Spectroscopy
The spectralAnalysis package allows users to pre-process, visualize and analyze spectroscopy data. Non-negative matrix factorization analysis is included.
The hyperSpec packages allows analysis of hyperspectral data, i.e., spectra plus further information such as spatial information, time, concentrations, etc. Such data are frequently encountered in the analysis of Raman, IR, NIR, UV/VIS, NMR, etc., spectroscopic data sets.
The ChemoSpec package collects user-friendly functions for plotting spectra (NMR, IR, etc) and carrying top-down exploratory data analysis, such as HCA, PCA and model-based clustering.
The HyperChemoBridge interconverts ChemoSpec and hyperSpec objects
The speaq package implements the hierarchical Cluster-based Peak Alignment (CluPA) and may be used for aligning NMR spectra.
Software for the book by Donald B. Percival and Andrew T. Walden, Spectral Analysis for Physical Applications, ISBN 978-0-521-43541-3, Cambridge University Press, 1993, is found in the package sapa.
The package TIMP provides a problem solving environment for fitting separable nonlinear models in physics and chemistry applications, and has been extensively applied to time-resolved spectroscopy data.
The package prospectr provides functions for pretreatment and sample selection of visible and near infrared diffuse reflectance spectra.
The resemble includes functions for spectral dissimilarity analysis and memory-based learning (a.k.a. local modeling) for non-linear modeling in spectral datasets.
The package ChemoSpec2D allows exploratory chemometrics of 2D spectroscopic data sets such as COSY (correlated spectroscopy) and HSQC (heteronuclear single quantum coherence) 2D NMR (nuclear magnetic resonance) spectra.
Mass Spectrometry
The MSnbase defines infrastructure for mass spectrometry-based proteomics data handling, plotting, processing and quantification.
The MALDIquant provides tools for quantitative analysis of MALDI-TOF mass spectrometry data, with support for baseline correction, peak detection and plotting of mass spectra.
The MALDIrppa provides methods for quality control and robust pre-processing and analysis of MALDI mass spectrometry data.
The OrgMassSpecR package is for organic/biological mass spectrometry, with a focus on graphical display, quantification using stable isotope dilution, and protein hydrogen/deuterium exchange experiments.
The FTICRMS package provides functions for Analyzing Fourier Transform-Ion Cyclotron ed Resonance Mass Spectrometry Data.
The titan provides a GUI to analyze mass spectrometric data on the relative abundance of two substances from a titration series.
The Bioconductor packages MassSpecWavelet, PROcess, and xcms are designed for the analysis of mass spectrometry data.
The apLCMS package is designed for the processing of LC/MS based metabolomics data.
The xMSanalyzer package allows merging apLCMS sample processing results from multiple sets of parameter settings, among other features.
The MSPrep package is for post-processing of metabolomic data, including summarization of replicates, filtering, imputation, and normalization.
The metaMS package is an MS-based metabolomics data processing and compound annotation pipeline.
Functional Magnetic Resonance Imaging
Functions for I/O, visualization and analysis of functional Magnetic Resonance Imaging (fMRI) datasets stored in the ANALYZE or NIFTI format are available in the package AnalyzeFMRI. The package fmri contains functions to analyze fMRI data using adaptive smoothing procedures.
Fluorescence Lifetime Imaging Microscopy
Functions for visualization and analysis of Fluorescence Lifetime Imaging Microscopy (FLIM) datasets are available in the package TIMP.
Fluorescence Excitation-Emission Matrix (EEM)
The EEM reads raw EEM data and prepares it for further analysis.
Carbon Dating
The package Bchron creates chronologies based on radiocarbon and non-radiocarbon dated depths.
Astronomy and astrophysics
The astrodatR package collects 19 datasets from contemporary astronomy research, many of which are described in the aforementioned textbook ‘Modern Statistical Methods for Astronomy with R Applications’.
The astrolibR package presents an R interface to low-level utilities and codes from the Interactive Data Language (IDL) Astronomy Users Library .
The CRAC collects R functions for cosmological research, with its main functions being similar to the python library, cosmolopy.
The RobPer package calculates periodograms based on (robustly) fitting periodic functions to light curves.
The package snapshot contains functions for reading and writing N-body snapshots from the GADGET code for cosmological N-body/SPH simulations.
The package UPMASK performs unsupervised photometric membership assignment in stellar clusters using, e.g., photometry and spatial positions.
The solaR package provides functions to determine the movement of the sun from the earth and to determine incident solar radiation.
The FITSio package provides utilities to read and write files in the FITS (Flexible Image Transport System) format, a standard format in astronomy.
The stellaR package manages and displays stellar tracks and isochrones from the Pisa low-mass database.
The astroFns provides miscellaneous astronomy functions, utilities, and data.
The cosmoFns contains standard expressions for distances, times, luminosities, and other quantities useful in observational cosmology, including molecular line observations.
The astro package provides tools for astronomy; functions provided may be grouped into 4 main areas: cosmology, FITS file manipulation, the Sersic function and general (plotting and scripting) tools.
The celestial package includes a number of common astronomy conversion routines, particularly the HMS and degrees schemes.
The SCEPtER package is used to estimate stellar mass and radius given observational data of effective temperature, [Fe/H], and astroseismic parameters.
The lira package performs Bayesian linear regression and forecasting in Astronomy, accounting for all kinds of errors and correlations in the data.
The astrochron package contains routines for astronomical time scale construction, time series analysis, time scale development, and paleoclimate analysis.
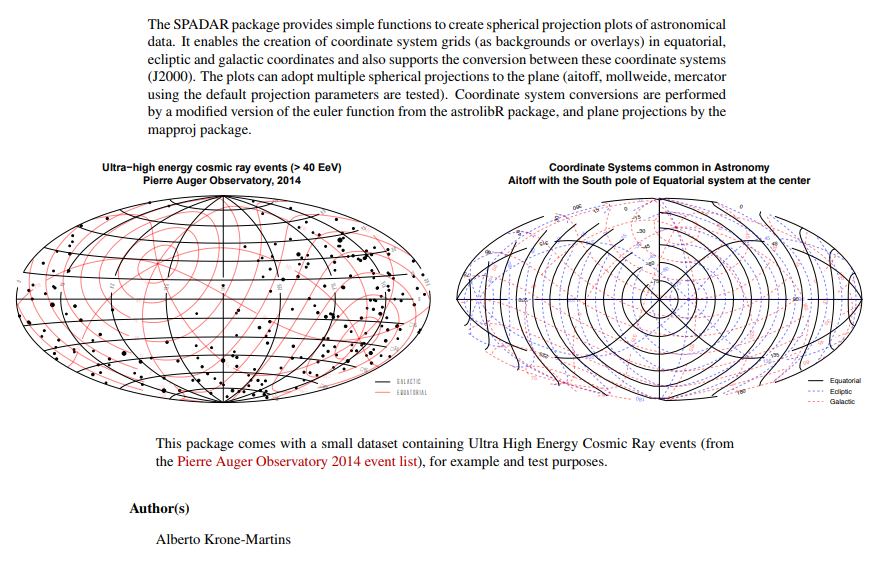
The SPADAR package provides functions to create all-sky grid plots of widely used astronomical coordinate systems (equatorial, ecliptic, galactic) and scatter plots of data on any of these systems, including on-the-fly system conversion.
The SCEPtERbinary allows for estimating the stellar age for double-lined detached binary systems, adopted from the effective temperature, the metallicity [Fe/H], the mass, and the radius of the two stars.
The Astrostatistics and Astroinformatics Portal is an R-centric collection of information regarding statistical analysis in astronomy.
Hans Werner Borchers has a page on Astronomy modules and links for R, Python, and Julia .
Optics and Scattering Approximations
The planar package provides code to simulate reflection and transmission at a multilayer planar interface.
The dielectric package defines some physical constants and dielectric functions commonly used in optics and plasmonics.
Energy Modeling
The solaR package provides functions to simulate and model systems involved in the capture and use of solar energy, including photovoltaics.
Positron Emission Tomography
The PET package implements different analytic/direct and iterative reconstruction methods for positron emission tomography (PET) data.
Water and Soil Chemistry
The AquaEnv package is a toolbox for aquatic chemical modelling focused on (ocean) acidification and CO2 air-water exchange.
See the Environmetrics task view for further related packages related to water and soil chemistry.
Titration Curves
The titrationCurves package provides functions to plot acid/base, complexation, redox, and precipitation titration curves.
Electrochemistry
The eChem package provides functions to simulate voltammetry, chronoamperometry and chronocoulometry experiments, which may be useful in courses in analytical chemistry.
CRAN packages:
ALS (core)
AnalyzeFMRI
AquaEnv
astro
astrochron
astrodatR
astroFns
astrolibR
ATmet
Bchron
BioMark
bvls
celestial
chemCal (core)
chemometrics
ChemometricsWithR
ChemoSpec
ChemoSpec2D
CHNOSZ
clustvarsel
compositions
constants
cosmoFns
CRAC
dielectric
drc
eChem
EEM
elasticnet
enpls
errors
fastICA
fingerprint
FITSio
fmri
fpca
FTICRMS
homals
hyperSpec
investr
Iso (core)
kohonen (core)
leaps
lira
lspls
MALDIquant
MALDIrppa
measurements
metRology
minpack.lm
NISTunits
nlme
nlreg
nnls (core)
OrgMassSpecR
pcaPP
PET
planar
pls (core)
plspm
ppls
prospectr
psy
PTAk (core)
rcdk
rcdklibs
represent
resemble
RobPer
rpubchem
sapa
SCEPtER
SCEPtERbinary
simecol
snapshot
solaR
som
SPADAR
speaq
spectralAnalysis
spls
stellaR
stepPlr
subselect
TIMP
titan
titrationCurves
units
UPMASK
varSelRF
webchem
WilcoxCV
Related links:
CRAN Task View: DifferentialEquations
CRAN Task View: Psychometrics
CRAN Task View: Cluster
CRAN Task View: Multivariate
CRAN Task View: Environmetrics
Bioconductor Package: alsace
Bioconductor Package: bioassayR
Bioconductor Package: ChemmineOB
Bioconductor Package: ChemmineR
Bioconductor Package: fmcsR
Bioconductor Package: gpls
Bioconductor Package: eiR
Bioconductor Package: MassSpecWavelet
Bioconductor Package: metaMS
Bioconductor Package: MSnbase
Bioconductor Package: PROcess
Bioconductor Package: xcms
R News: R in Chemistry
Journal of Statistical Software: Spectroscopy and Chemometrics in R
apLCMS
Interactive Data Language (IDL) Astronomy Users Library
Astrostatistics and Astroinformatics Portal Software Forum
Chemistry Development Kit (CDK)
MSPrep
OpenBabel
PubChem
xMSanalyzer
GitHub Project: HyperChemoBridge
Chemical Identifier Resolver
ChemSpider
Chemical Translation Service
PAN Pesticide Database
Alan Wood's Compendium of Pesticide Common Names
PHYSPROP Database
ETOX
PPDB
ChemIDplus
Astronomy modules and links for R, Python, and Julia
Came across this recent R package. Looks like it was a school project at UCLA recently. Has pretty good coverage of topics and areas of focus that Miles (and team) has touched on over the years. Worth checking out especially the SOM functions:
https://cran.r-project.org/web/views/ChemPhys.html
-------------------
Chemometrics and Computational Physics
Maintainer: Katharine Mullen
Contact: katharine.mullen at stat.ucla.edu
Version: 2019-06-04
URL: https://CRAN.R-project.org/view=ChemPhys
Chemometrics and computational physics are concerned with the analysis of data arising in chemistry and physics experiments, as well as the simulation of physico-chemico systems. Many of the functions in base R are useful for these ends.
The book Chemometrics with R by Ron Wehrens, ISBN: 978-3-642-17840-5, Springer, 2011, provides an introduction to multivariate statistics in the life sciences, as well as coverage of several specific topics from the area of chemometrics; the examples in the book are possible to reproduce using the package ChemometricsWithR.
The book Modern Statistical Methods for Astronomy With R Applications by Eric D. Feigelson and G. Jogesh Babu, ISBN-13: 9780521767279, Cambridge, 2012, provides an introduction to statistics for astronomers and an overview of the foremost methods being used in astrostatistical analysis, illustrated by examples in R.
The book by Kurt Varmuza and Peter Filzmoser, Introduction to Multivariate Statistical Analysis in Chemometrics, ISBN 978-1-420-05947-2, CRC Press, 2009, is associated with the package chemometrics.
A special issue of R News with a focus on R in Chemistry was published in August 2006. A special volume of Journal of Statistical Software (JSS) dedicated to oscopy and Chemometrics in R was published in January 2007.
Please let us know if we have omitted something of importance, or if a new package or function should be mentioned here.
Linear Regression Models
Linear models can be fitted (via OLS) with lm() (from stats). A least squares solution for x in Ax = b can also be computed as qr.coef(qr(A), b).
The package nnls provides a means of constraining x to non-negative or non-positive values; the package bvls allows other bounds on x to be applied.
Functions for isotonic regression are available in the package Iso, and are useful to determine the unimodal vector that is closest to a given vector x under least squares criteria.
Heteroskedastic linear models can be fit using the gls() function of the nlme package.
Nonlinear Regression Models
The nls() function (from stats) as well as the package minpack.lm allow the solution of nonlinear least squares problems.
Correlated and/or unequal variances can be modeled using the gnls() function of the nlme package and by nlreg.
Curve Resolution
The PTAk package provides functions for Principal Tensor Analysis on k modes. The package includes also some other multiway methods: PCAn (Tucker-n) and PARAFAC/CANDECOMP.
Multivariate curve resolution alternating least squares (MCR-ALS) is implemented in the package ALS.
The alsace package provides MCR-ALS support for Liquid chromatography with PhotoDiode Array Detection (LC-DAD) data with many injections, with features for peak alignment and identification.
The package drc provides functions for the analysis of one or multiple non-linear curves with focus on models for concentration-response, dose-response and time-response data.
Partial Least Squares
The package pls implements Partial Least Squares Regression (PLSR) and Principal Component Regression (PCR).
The package lspls implements the least squares-partial least squares (LS-PLS) method.
Penalized Partial Least Squares is implemented in the ppls package.
Sparse PLS is implemented in the package spls package.
The gpls package implements generalized partial least squares, based on the Iteratively ReWeighted Least Squares (IRWLS) method of Brian Marx.
Package plspm contains, in addition to the usual functions for PLS regression, also functions for path modeling.
The package enpls implements ensemble partial least squares, a framework for measuring feature importance, outlier detection, and ensemble modeling based on (sparse) partial least squares regressions.
Principal Component Analysis
Principal component analysis (PCA) is in the package stats as functions princomp(). Some graphical PCA representations can be found in the psy package.
The homals package provides nonlinear PCA and, by defining sets, nonlinear canonical correlation analysis (models of the Gifi-family).
A desired number of robust principal components can be computed with the pcaPP package. The package elasticnet is applicable to sparse PCA. The package fpca can be applied to restricted MLE for functional PCA.
See the Multivariate task view for further packages dealing with PCA and other projection methods.
Factor Analysis
Factor analysis (FA) is in the package stats as functions factanal(); see Psychometrics task view for details on extensions.
Compositional Data Analysis
The package compositions provides functions for the consistent analysis of compositional data (e.g. portions of substances) and positive numbers (e.g. concentrations). See also the book, Analyzing Compositional Data with R by K. Gerald von den Boogaart und Raimon Tolosana-Delgado, ISBN: 978-3-642-36808-0, Springer, 2013.
Independent Component Analysis
Independent component analysis (ICA) can be computed using fastICA.
Clustering
The Cluster task view provides a list of packages that can be used for clustering problems.
Variable Selection
Stepwise variable selection for linear models, using AIC, is available in function step(); package leaps implements leaps-and-bounds variable selection, by default using Mallow's Cp. stepPlr provides stepwise variable selection for penalized logistic regression.
Variable selection based on evolutionary algorithms is available in package and subselect. The latter also provides simulated annealing and leaps-and-bounds algorithms, as well as local refinements.
Package varSelRF provides variable selection methods for random forests. Cross-validation-based variable selection using Wilcoxon rank sum tests is available in package WilcoxCV, focused on binary classification in microarrays. Package clustvarsel implements variable selection for model-based clustering.
The BioMark package implements two meta-methods for variable selection: stability selection (applying a primary selection method like a t-test, VIP value or PLSDA regression coefficient) to different subsets of the data, and higher criticism, which provides a data-driven choice of significance cutoffs in statistical testing.
Self-Organizing Maps
The kohonen package implements self-organizing maps as well as some extensions for supervised pattern recognition and data fusion. The som package provides functions for self-organizing maps.
Differential Equations
See the DifferentialEquations task view packages dealing with differential equations.
Metrology
The units package attaches unit metadata to vectors, matrices and arrays, providing automatic propagation, conversion, derivation and simplification of units.
The errors attaches uncertainty metadata to vectors, matrices and arrays, providing automatic propagation and reporting.
The constants package provides values of the fundamental physical constants based on values reported by the Committee on Data for Science and Technology (CODATA), an interdisciplinary committee of the International Council for Science.
NISTunits also provides values of the fundamental physical constants. The values it contains are based on the values reported by the National Institute of Standards and Technology, (NIST).
The measurements contains tools to make working with physical measurements easier, such as functions to convert between metric and imperial units, or to calculate a dimension's unknown value from other dimensions' measurements.
The metRology package provides support for metrology applications, including measurement uncertainty estimation and inter-laboratory metrology comparison studies.
The ATmet package provides functions for smart sampling and sensitivity analysis for metrology applications, including computationally expensive problems.
Calibration
The investr package facilitates calibration/inverse estimation with linear and nonlinear regression models.
The chemCal package provides functions for plotting linear calibration functions and estimating standard errors for measurements.
The nlreg package is useful for nonlinear calibration models.
The package represent calculates the 'representativity' of two multidimensional datasets, which involves comparison of the similarity of principal component analysis loading patterns, variance-covariance matrix structures, and data set centroid locations.
Cellular Automata
The simecol package includes functions for cellular automata modeling.
Thermodynamics
The CHNOSZ package provides functions for calculating the standard Gibbs energies and other thermodynamic properties, and chemical affinities of reactions between species contained in a thermodynamic database.
Interfaces to External Libraries
The package rcdk allows the user to access functionality in the Chemistry Development Kit (CDK), a Java framework for cheminformatics. This allows the user to load molecules, evaluate fingerprints (via the package fingerprint), calculate molecular descriptors and so on. In addition, the CDK API allows the user to view structures in 2D. The rcdklibs package provides the CDK libraries for use in R.
The rpubchem package gives access to PubChem data (compounds, substance, assays).
ChemmineR is a cheminformatics toolkit for analyzing small molecules in R. Its add-on packages include fmcsR for mismatch tolerant maximum common substructure matching, eiR for accelerated structure similarity searching; bioassayR for analyzing bioactivity data, and ChemmineOB for accessing OpenBabel functionalities from R.
The webchem package allows users to retrieve chemical information from various sources on the web and to interact with various APIs. Sources include: Chemical Identifier Resolver , ChemSpider , PubChem , Chemical Translation Service , PAN Pesticide Database , Alan Wood's Compendium of Pesticide Common Names , PHYSPROP Database , ETOX , PPDB , and ChemIDplus .
Spectroscopy
The spectralAnalysis package allows users to pre-process, visualize and analyze spectroscopy data. Non-negative matrix factorization analysis is included.
The hyperSpec packages allows analysis of hyperspectral data, i.e., spectra plus further information such as spatial information, time, concentrations, etc. Such data are frequently encountered in the analysis of Raman, IR, NIR, UV/VIS, NMR, etc., spectroscopic data sets.
The ChemoSpec package collects user-friendly functions for plotting spectra (NMR, IR, etc) and carrying top-down exploratory data analysis, such as HCA, PCA and model-based clustering.
The HyperChemoBridge interconverts ChemoSpec and hyperSpec objects
The speaq package implements the hierarchical Cluster-based Peak Alignment (CluPA) and may be used for aligning NMR spectra.
Software for the book by Donald B. Percival and Andrew T. Walden, Spectral Analysis for Physical Applications, ISBN 978-0-521-43541-3, Cambridge University Press, 1993, is found in the package sapa.
The package TIMP provides a problem solving environment for fitting separable nonlinear models in physics and chemistry applications, and has been extensively applied to time-resolved spectroscopy data.
The package prospectr provides functions for pretreatment and sample selection of visible and near infrared diffuse reflectance spectra.
The resemble includes functions for spectral dissimilarity analysis and memory-based learning (a.k.a. local modeling) for non-linear modeling in spectral datasets.
The package ChemoSpec2D allows exploratory chemometrics of 2D spectroscopic data sets such as COSY (correlated spectroscopy) and HSQC (heteronuclear single quantum coherence) 2D NMR (nuclear magnetic resonance) spectra.
Mass Spectrometry
The MSnbase defines infrastructure for mass spectrometry-based proteomics data handling, plotting, processing and quantification.
The MALDIquant provides tools for quantitative analysis of MALDI-TOF mass spectrometry data, with support for baseline correction, peak detection and plotting of mass spectra.
The MALDIrppa provides methods for quality control and robust pre-processing and analysis of MALDI mass spectrometry data.
The OrgMassSpecR package is for organic/biological mass spectrometry, with a focus on graphical display, quantification using stable isotope dilution, and protein hydrogen/deuterium exchange experiments.
The FTICRMS package provides functions for Analyzing Fourier Transform-Ion Cyclotron ed Resonance Mass Spectrometry Data.
The titan provides a GUI to analyze mass spectrometric data on the relative abundance of two substances from a titration series.
The Bioconductor packages MassSpecWavelet, PROcess, and xcms are designed for the analysis of mass spectrometry data.
The apLCMS package is designed for the processing of LC/MS based metabolomics data.
The xMSanalyzer package allows merging apLCMS sample processing results from multiple sets of parameter settings, among other features.
The MSPrep package is for post-processing of metabolomic data, including summarization of replicates, filtering, imputation, and normalization.
The metaMS package is an MS-based metabolomics data processing and compound annotation pipeline.
Functional Magnetic Resonance Imaging
Functions for I/O, visualization and analysis of functional Magnetic Resonance Imaging (fMRI) datasets stored in the ANALYZE or NIFTI format are available in the package AnalyzeFMRI. The package fmri contains functions to analyze fMRI data using adaptive smoothing procedures.
Fluorescence Lifetime Imaging Microscopy
Functions for visualization and analysis of Fluorescence Lifetime Imaging Microscopy (FLIM) datasets are available in the package TIMP.
Fluorescence Excitation-Emission Matrix (EEM)
The EEM reads raw EEM data and prepares it for further analysis.
Carbon Dating
The package Bchron creates chronologies based on radiocarbon and non-radiocarbon dated depths.
Astronomy and astrophysics
The astrodatR package collects 19 datasets from contemporary astronomy research, many of which are described in the aforementioned textbook ‘Modern Statistical Methods for Astronomy with R Applications’.
The astrolibR package presents an R interface to low-level utilities and codes from the Interactive Data Language (IDL) Astronomy Users Library .
The CRAC collects R functions for cosmological research, with its main functions being similar to the python library, cosmolopy.
The RobPer package calculates periodograms based on (robustly) fitting periodic functions to light curves.
The package snapshot contains functions for reading and writing N-body snapshots from the GADGET code for cosmological N-body/SPH simulations.
The package UPMASK performs unsupervised photometric membership assignment in stellar clusters using, e.g., photometry and spatial positions.
The solaR package provides functions to determine the movement of the sun from the earth and to determine incident solar radiation.
The FITSio package provides utilities to read and write files in the FITS (Flexible Image Transport System) format, a standard format in astronomy.
The stellaR package manages and displays stellar tracks and isochrones from the Pisa low-mass database.
The astroFns provides miscellaneous astronomy functions, utilities, and data.
The cosmoFns contains standard expressions for distances, times, luminosities, and other quantities useful in observational cosmology, including molecular line observations.
The astro package provides tools for astronomy; functions provided may be grouped into 4 main areas: cosmology, FITS file manipulation, the Sersic function and general (plotting and scripting) tools.
The celestial package includes a number of common astronomy conversion routines, particularly the HMS and degrees schemes.
The SCEPtER package is used to estimate stellar mass and radius given observational data of effective temperature, [Fe/H], and astroseismic parameters.
The lira package performs Bayesian linear regression and forecasting in Astronomy, accounting for all kinds of errors and correlations in the data.
The astrochron package contains routines for astronomical time scale construction, time series analysis, time scale development, and paleoclimate analysis.
The SPADAR package provides functions to create all-sky grid plots of widely used astronomical coordinate systems (equatorial, ecliptic, galactic) and scatter plots of data on any of these systems, including on-the-fly system conversion.
The SCEPtERbinary allows for estimating the stellar age for double-lined detached binary systems, adopted from the effective temperature, the metallicity [Fe/H], the mass, and the radius of the two stars.
The Astrostatistics and Astroinformatics Portal is an R-centric collection of information regarding statistical analysis in astronomy.
Hans Werner Borchers has a page on Astronomy modules and links for R, Python, and Julia .
Optics and Scattering Approximations
The planar package provides code to simulate reflection and transmission at a multilayer planar interface.
The dielectric package defines some physical constants and dielectric functions commonly used in optics and plasmonics.
Energy Modeling
The solaR package provides functions to simulate and model systems involved in the capture and use of solar energy, including photovoltaics.
Positron Emission Tomography
The PET package implements different analytic/direct and iterative reconstruction methods for positron emission tomography (PET) data.
Water and Soil Chemistry
The AquaEnv package is a toolbox for aquatic chemical modelling focused on (ocean) acidification and CO2 air-water exchange.
See the Environmetrics task view for further related packages related to water and soil chemistry.
Titration Curves
The titrationCurves package provides functions to plot acid/base, complexation, redox, and precipitation titration curves.
Electrochemistry
The eChem package provides functions to simulate voltammetry, chronoamperometry and chronocoulometry experiments, which may be useful in courses in analytical chemistry.
CRAN packages:
ALS (core)
AnalyzeFMRI
AquaEnv
astro
astrochron
astrodatR
astroFns
astrolibR
ATmet
Bchron
BioMark
bvls
celestial
chemCal (core)
chemometrics
ChemometricsWithR
ChemoSpec
ChemoSpec2D
CHNOSZ
clustvarsel
compositions
constants
cosmoFns
CRAC
dielectric
drc
eChem
EEM
elasticnet
enpls
errors
fastICA
fingerprint
FITSio
fmri
fpca
FTICRMS
homals
hyperSpec
investr
Iso (core)
kohonen (core)
leaps
lira
lspls
MALDIquant
MALDIrppa
measurements
metRology
minpack.lm
NISTunits
nlme
nlreg
nnls (core)
OrgMassSpecR
pcaPP
PET
planar
pls (core)
plspm
ppls
prospectr
psy
PTAk (core)
rcdk
rcdklibs
represent
resemble
RobPer
rpubchem
sapa
SCEPtER
SCEPtERbinary
simecol
snapshot
solaR
som
SPADAR
speaq
spectralAnalysis
spls
stellaR
stepPlr
subselect
TIMP
titan
titrationCurves
units
UPMASK
varSelRF
webchem
WilcoxCV
Related links:
CRAN Task View: DifferentialEquations
CRAN Task View: Psychometrics
CRAN Task View: Cluster
CRAN Task View: Multivariate
CRAN Task View: Environmetrics
Bioconductor Package: alsace
Bioconductor Package: bioassayR
Bioconductor Package: ChemmineOB
Bioconductor Package: ChemmineR
Bioconductor Package: fmcsR
Bioconductor Package: gpls
Bioconductor Package: eiR
Bioconductor Package: MassSpecWavelet
Bioconductor Package: metaMS
Bioconductor Package: MSnbase
Bioconductor Package: PROcess
Bioconductor Package: xcms
R News: R in Chemistry
Journal of Statistical Software: Spectroscopy and Chemometrics in R
apLCMS
Interactive Data Language (IDL) Astronomy Users Library
Astrostatistics and Astroinformatics Portal Software Forum
Chemistry Development Kit (CDK)
MSPrep
OpenBabel
PubChem
xMSanalyzer
GitHub Project: HyperChemoBridge
Chemical Identifier Resolver
ChemSpider
Chemical Translation Service
PAN Pesticide Database
Alan Wood's Compendium of Pesticide Common Names
PHYSPROP Database
ETOX
PPDB
ChemIDplus
Astronomy modules and links for R, Python, and Julia
Cr6- Admin
- Posts : 1178
Join date : 2014-08-09 -

Re: Chemometrics and Computational Physics (R package by Katherine Mulllen at UCLA)
![]() by LongtimeAirman Wed Aug 07, 2019 2:39 pm
by LongtimeAirman Wed Aug 07, 2019 2:39 pm
https://cran.r-project.org/web/views/ChemPhys.html
Hi Cr6, that’s a fine addition to References. Including links to some mighty nice packages. Here’s something for Team Miles to consider - SPADAR.
.
Hi Cr6, that’s a fine addition to References. Including links to some mighty nice packages. Here’s something for Team Miles to consider - SPADAR.

.
LongtimeAirman- Admin
- Posts : 2078
Join date : 2014-08-10
» R package convertr
» Microcosm - Physics
» Mathisian Physics and LENR
» The Math and Physics of Billiards
» Physics Timeline for Understanding
» Microcosm - Physics
» Mathisian Physics and LENR
» The Math and Physics of Billiards
» Physics Timeline for Understanding
Page 1 of 1
Permissions in this forum:
You cannot reply to topics in this forum